

Product Details
Place of Origin: China
Brand Name: NetTAP®
Certification: CCC, CE, RoHS
Model Number: MATRIX-TCA-CG
Payment & Shipping Terms
Minimum Order Quantity: 1 SET
Price: Can Discuss
Packaging Details: Outer Carton plus Inner Foam
Delivery Time: 1-3 Working Days
Payment Terms: L/C, D/A, D/P, T/T, Western Union, MoneyGram
Supply Ability: 100 sets per month
Applications: |
Data Center, Cloud, Network Edge |
Analysis: |
Data Audit, Bigdata Security, Access Behavior |
Data Query: |
Current And Historical Traffic Trend |
Link Mirror: |
Traffic Replication And Aggregation |
Traffic Forward: |
IDS, Data Audit, Behavior Analysis, Situational Awareness |
Etwork Architecture: |
1G, 10G, 40G, 100G Or Above |
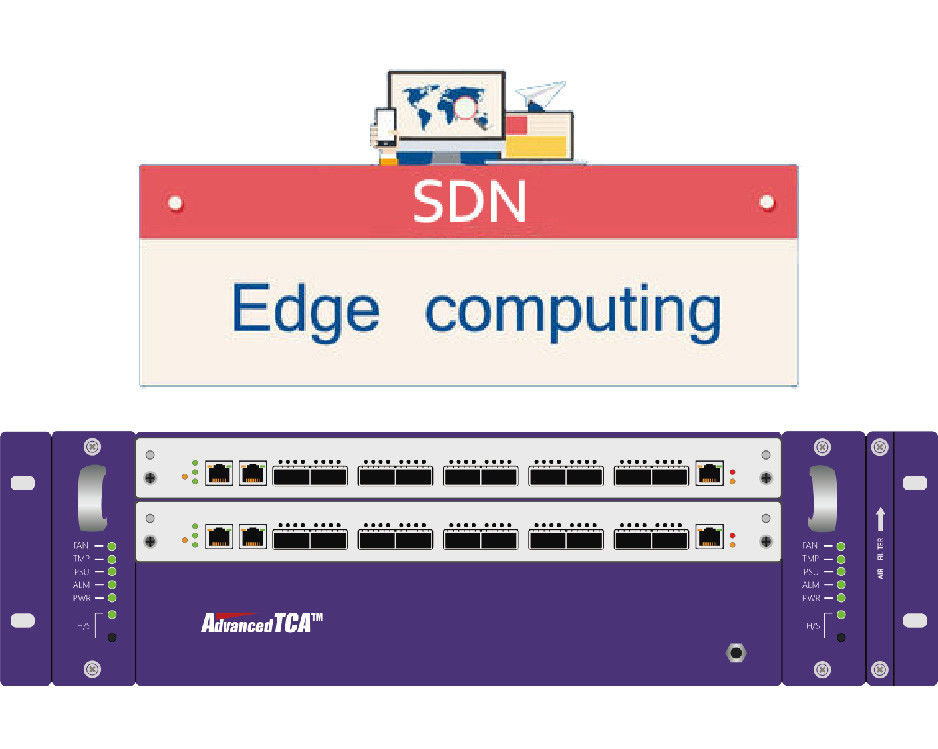
NetInsight™ Network Traffic Visibility TAPs Manage your Network Edge Computing
NetTAP® NetInsight™ Network Visibility Management Background
Cloud e-government network security system planning is mainly composed of the physical layer, resource layer, application security, and data collection mainly involves in the network layer, the cloud in the electronic government affairs, by deploying meet the requirements of relevant safety products for real-time monitoring network data analysis so as to achieve security monitoring, security situational awareness effect. Such security products can be subdivided into IDS, Data Audit Equipment, Behavior Analysis equipment, Situational Awareness, Big Data Security Analysis System, etc., but this kind of equipment does not have the active Data Capture function.Therefore, in the complicated e-government network architecture, the cloud, when performing a multilevel security need to deploy a large number of security products at different positions of nodes in the network security monitoring, at the same time a large number of security products distributed deployment, has the high investment cost, easy to form the information isolated island, lead to monitor the blind spot, and also can't avoid duplicate data monitoring, not only reduces the analysis accuracy, but also caused the difficulty of management and maintenance.
NetTAP® has been committed to for all enterprise users with entire network flow visualization acquisition monitoring solution, after 10 years of technology accumulation and precipitation, releasing MB, Gigabit, 10G, 40G, 100G and other highly dense flow visualization acquisition monitoring equipment, independent research and development of MATRIX - NetInsightTM lead network visualization monitoring tide flow visualization system, have powerful SDN(Software Defined Network) flow collection and distribution of MATRIX, network video, business function such as visual and abnormal flow storage module, for the whole network security situational awareness to build a strong support network level.
![]()
NetTAP® MATRIX NetInsight™ Network Architecture
The matrix-netinsight traffic visualization system consists of three components:
1- SDN traffic collection and distribution matrix.This component by one or more high performance hardware ASIC chip as the core of the high-speed flow collection and distribution equipment units, internal through flexible SDN network technology, many sets of collection and distribution equipment together to form a highly flexible mirror/spectral flow collection and distribution of matrix, can collect target as many as several hundred network node of the network raw traffic data;At the same time, this matrix can flexibly classify and filter the traffic according to the policy, and distribute the traffic data line to the back-end security analysis system or business analysis system of different dimensions according to different traffic types.
2- MATRIX traffic collection and distribution visual management system.Technology, the component is based on centralized SDN controller aiming at link and flow visualization, fusion user network topology, SDN collection and distribution of equipment unit connection topology, background security analysis system, the business analysis equipment, all related to monitor the flow of the unit in the same visual view display, provide a clear purpose collection source of visual flow, good flow distribution packet length distribution of model visualization, visualization, flow trend of flow visualization, visualization flow gathering and distribution strategy.
3- NetInsight flow data visualization and analysis system.Based on the MATRIX traffic collection and distribution visualization system, the component collects and analyzes the whole network traffic comprehensively and realizes the visualization of network traffic data.The visualization of network traffic data is mainly embodied in:
A) Communication Node Visibility.Through the collection, restoration and analysis of the whole network data flow, the system can find all communication terminal nodes and server nodes in the network, and can identify the key information of the target node (operating system, host name or part of the terminal model, etc.) according to the fingerprint characteristics in the communication content.The entry of new communication nodes can produce corresponding alarms.
B) Network Quality Visibility.Through the reduction analysis of the protocol layer, the system can accurately identify the transmission delay, application layer response delay, message retransmission frequency, connection establishment time, connection establishment success rate and other parameters that reflect the critical network quality of the application of the critical service network, so that users can be clear about the quality state of network communication.
C) Visualization of network content distribution.System adopts the depth of the DPI message identification technology, accurate analysis of various traffic carries the application layer protocol content, and statistics in the network application layer protocol for various load flow proportion, through the modeling of traffic accounted for modeling analysis, and then through the unified visual platform for data display, let users on network load have an intuitive grasp the content of the data.
D) Message Tracking Visibility.In case of abnormal events or fault events, the cooperation between MATRIX traffic collection and distribution visualization component and NetInsight traffic data visualization analysis component can realize accurate path tracking of abnormal fault data messages, and clearly and accurately locate the transmission path of messages and the delay status of messages at each node.
E) Fault Location Visibility.Through the close cooperation of all components of the whole system, matrix-netinsight system can assist users in accurate and visual fault location, display and alarm of faults on the unified visualization platform, improve the positioning speed of users' network failures and information security events, and reduce event losses.
The recommended Network Packet Broker type with MATRIX NetInsight™ Network Visibility Platform:
![]()

